| Jump to section |
Assembly statistics | Repeat annotation | Protein-coding genes prediction |
| Non-protein-coding genes annotation | Gene Function annotation |
Assembly statistics
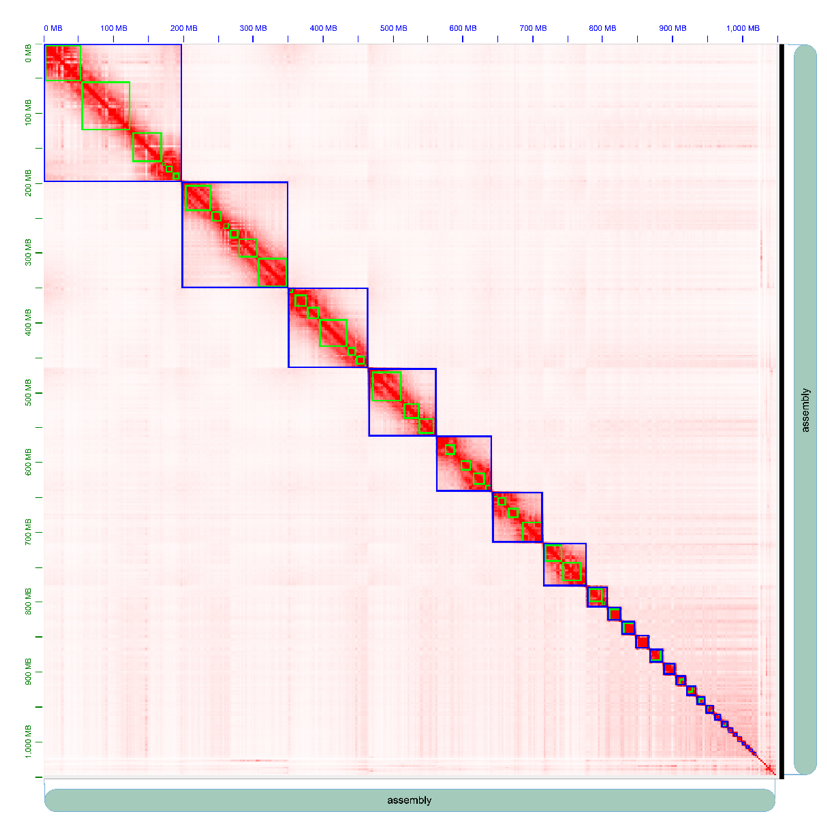
Assessment of Hi-c assembly
| Sequenced Read Pairs | 353,303,359 |
| Normal Paired | 119,503,007 (33.82%) |
| Chimeric Paired | 154,299,354 (43.67%) |
| Chimeric Ambiguous | 72,571,301 (20.54%) |
| Unmapped | 6,929,697 (1.96%) |
| Ligation Motif Present | 304,929,764 (86.31%) |
| Alignable (Normal+Chimeric Paired) | 273,802,361 (77.50%) |
| Unique Reads | 241,663,703 (68.40%) |
| PCR Duplicates | 31,216,962 (8.84%) |
| Optical Duplicates | 921,696 (0.26%) |
| Library Complexity Estimate | 1,099,873,512 |
| Intra-fragment Reads | 3,388,387 (0.96% / 1.40%) |
| Below MAPQ Threshold | 22,518,708 (6.37% / 9.32%) |
| Hi-C Contacts | 215,756,608 (61.07% / 89.28%) |
| Ligation Motif Present | 126,288,033 (35.74% / 52.26%) |
| 3' Bias (Long Range) | 76% - 24% |
| Pair Type %(L-I-O-R) | 25% - 25% - 25% - 25% |
| Inter-chromosomal | 118,197,762 (33.46% / 48.91%) |
| Intra-chromosomal | 97,558,846 (27.61% / 40.37%) |
| Short Range (<20Kb) | 52,730,723 (14.93% / 21.82%) |
| Long Range (>20Kb) | 44,827,949 (12.69% / 18.55%) |
Summary of genome
| Stat Type | Revised genome | Final assembly | ||
| contig Length | contig Number | scaffold Length | scaffold Number | |
| N90 | 1,623,455 | 98 | 13,092,000 | 16 |
| N80 | 4,324,123 | 58 | 20,137,632 | 10 |
| N70 | 8,097,362 | 40 | 61,566,867 | 7 |
| N60 | 12,315,090 | 30 | 79,303,508 | 5 |
| N50 | 14,174,297 | 22 | 98,083,000 | 4 |
| N40 | 17,358,682 | 15 | 113,403,698 | 3 |
| N30 | 17,358,682 | 15 | 113,403,698 | 3 |
| N20 | 30,229,578 | 6 | 153,175,500 | 2 |
| N10 | 35,139,116 | 3 | 199,086,795 | 1 |
| Max length | 42,031,810 | 199,086,795 | ||
| Total length | 1,044,489,195 | 1,049,889,730 | ||
| Total number | 1,003 | 1,127 | ||
| Average length | 1,041,365 | 931,579 | ||
Statistic of BUSCO(aves)
| Gene numbers | Percentage | |
|---|---|---|
| Complete BUSCOs | 4643 | 94.5% |
| Complete BUSCOs | 4643 | 94.5% |
| Complete and single-copy BUSCOs | 4586 | 93.3% |
| Complete and duplicated BUSCOs | 57 | 1.2% |
| Fragmented BUSCOs | 151 | 3.1% |
| Missing BUSCOs | 121 | 2.4% |
| Total BUSCO groups searched | 4915 | - |
Repeat annotation
Tandem repeats were identified across the genome with the help of the program Tandem Repeats Finder (TRF). Transposable elements (TEs) in the genome were identified by a combination of homology-based and de novo approaches. For homolog based prediction, known repeats were identified using RepeatMasker and RepeatProteinMask against Repbase (Repbase Release 16.10; http://www.girinst.org/repbase/index.html). For de novo prediction, RepeatModeler(http://repeatmasker.org/), LTR FINDER (http://tlife.fudan.edu.cn/ltr_finder/) were used to identify de novo evolved repeats inferred from the assembled genome.
Statistics of Repeats in Numida meleagris Genome
| Type | Repeat Size (bp) | % of genome |
|---|---|---|
| Trf | 10,581,766 | 1.007893 |
| Repeatmasker | 94,624,222 | 9.012777 |
| Proteinmask | 68,314,708 | 6.506846 |
| De novo | 131,715,232 | 12.545625 |
| Total | 143,202,256 | 13.639743 |
TEs Content in the Assembled Numida meleagris Genome
| Repbase TEs | TE protiens | De novo | Combined TEs | |||||
|---|---|---|---|---|---|---|---|---|
| Type | Length (Bp) | % in genome | Length (Bp) | % in genome | Length (Bp) | % in genome | Length (Bp) | % in genome |
| DNA | 9,432,380 | 0.898416 | 4,697,710 | 0.447448 | 8,786,941 | 0.836939 | 11,517,584 | 1.097028 |
| LINE | 66,938,260 | 6.375742 | 55,912,223 | 5.325533 | 86,205,096 | 8.210871 | 100,871,061 | 9.607777 |
| SINE | 439,058 | 0.041819 | 0 | 0 | 148,336 | 0.014129 | 502,770 | 0.047888 |
| LTR | 17,952,541 | 1.709945 | 7,771,775 | 0.740247 | 40,304,124 | 3.838891 | 44,706,385 | 4.258198 |
| Other | 1,197 | 0.000114 | 0 | 0 | 0 | 0 | 1,197 | 0.000114 |
| Unknown | 0 | 0 | 0 | 0 | 8,436,472 | 0.803558 | 8,436,472 | 0.803558 |
| Total | 94,624,222 | 9.012777 | 68,314,708 | 6.506846 | 129,576,315 | 12.341898 | 135,541,039 | 12.910026 |
Note: Repbase TEs: the result of RepeatMasker based on Repbase; TE proteins: the result of RepeatProteinMask based on Repbase; De novo: de novo finding repeats (Reaptmodeler); Combined: combine the results of Repbase TEs, TE proteins and de novo.
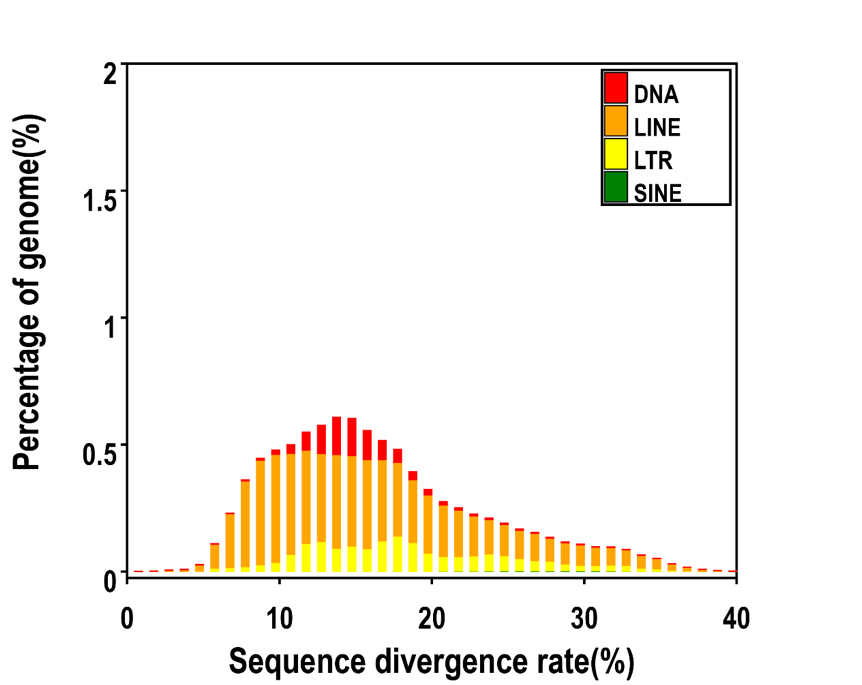
Distribution of Divergence Rate of each Type of Numida meleagris's TE. The divergence rate was calculated between the identified TE elements in the genome by homology-based method and the consensus sequence in the Repbase.
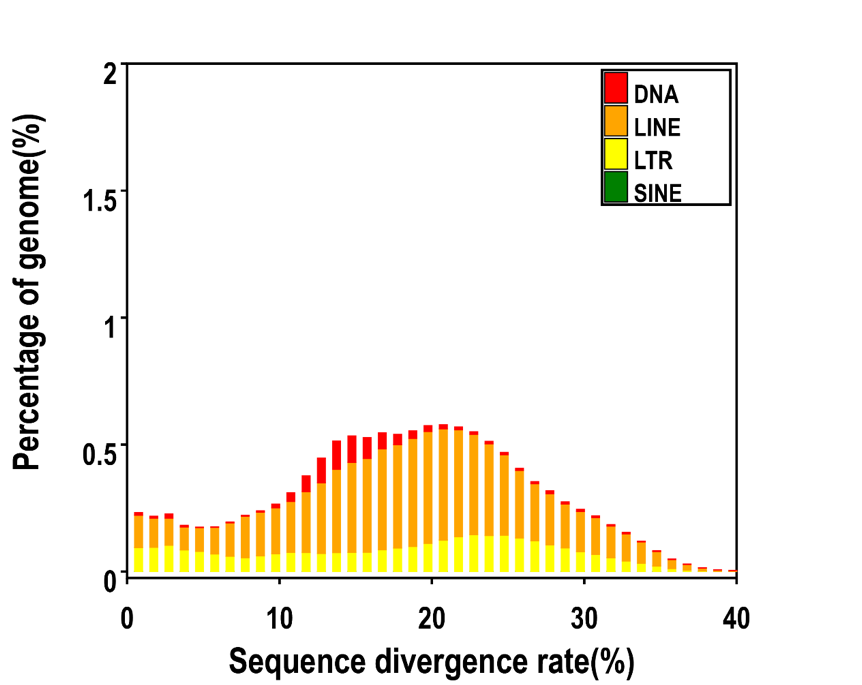
Distribution of Divergence Rate of each Type of Numida meleagris's TE. The divergence rate was calculated between the identified TE elements in the genome by De novo method and the consensus sequence in the predicted TE library.
Protein-coding genes prediction
To predict protein-coding genes, we used both homology-based and de novo prediction methods.
Homology based gene prediction
Proteins of all species were used in the homology-based annotation. First, TBLASTN was processed with parameters of “E-value = 1e-5, -F F”. BLAST hits that correspond to reference proteins were concatenated by Solar software, and low-quality records were filtered. Genomic sequence of each reference protein was extended upstream and downstream by 2000 bp to represent a protein-coding region. GeneWise software was used to predict gene structure contained in each protein region.
De novo gene prediction
In addition we used three de novo prediction programs: Augustus and GlimmerHMM, GENESCAN. Augustus with gene model parameters trained from Numida meleagris,which seted up by PASA. GlimmerHMM and GENESCAN with gene model parameters trained from human. We filtered partial genes and small genes with less than 150 bp coding lengths.
High-confidence gene model generation
Finally, comprehensive above predicted results, and coupled with the transcriptome comparison data by PASA (http://pasa.sourceforge.net/). All kinds of gene sets merged by EVidenceModeler (EVM entry, http://evidencemodeler.sourceforge.net/) integration software, get a non redundant, a more complete set of genes.
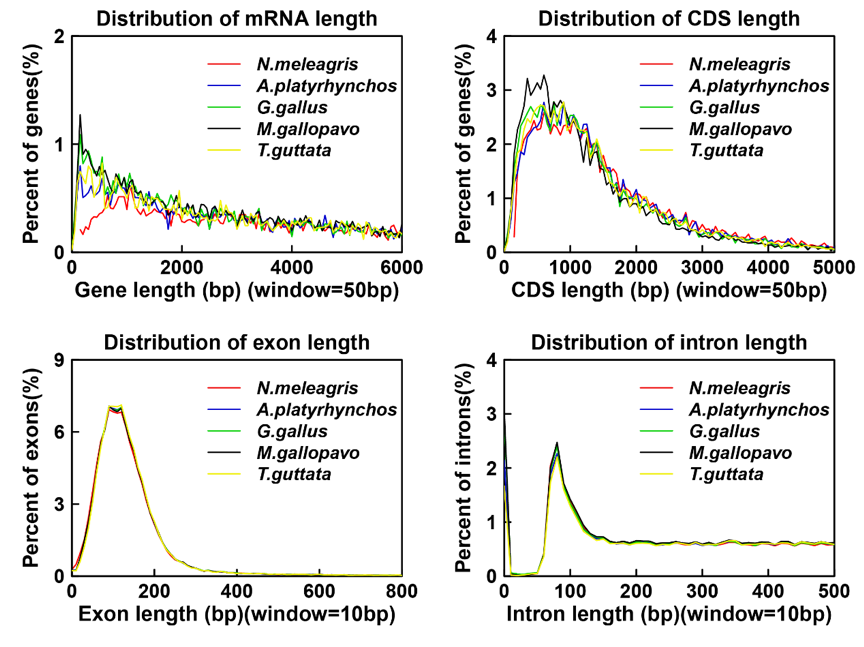
Numida meleagris's gene length distribution
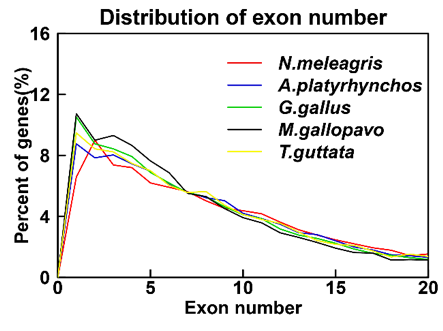
Numida meleagris's exon number
Gene annotation statistics for Numida meleagris genome
| Methods | Gene Number | Avg. mRNA Length | Total Exon Number | Avg. Exon Length | Avg. CDS Length | Avg. Exon Number | Total Intron Length |
|---|---|---|---|---|---|---|---|
| ab initio | |||||||
| augustus | 15,034 | 20854.37535 | 145,599 | 168.7409186 | 1634.196421 | 9.684648131 | 288,956,170 |
| glimmerHMM | 62,813 | 10908.09057 | 296,012 | 186.8550261 | 880.5713785 | 4.712591343 | 629,858,563 |
| genscan | 32,841 | 23552.69565 | 275,436 | 168.7314512 | 1415.143144 | 8.38695533 | 727,019,362 |
| Homology | |||||||
| A.platyrhynchos | 14,629 | 22623.02748 | 148,438 | 166.8307441 | 1692.803473 | 10.14683164 | 306,188,247 |
| G.gallus | 15,995 | 20337.90816 | 150,308 | 165.3216795 | 1553.558675 | 9.397186621 | 300,455,670 |
| M.gallopavo | 17,127 | 16937.7501 | 152,014 | 165.2556278 | 1466.758276 | 8.87569335 | 264,971,677 |
| T.guttata | 14,166 | 21562.46019 | 138,986 | 165.3593455 | 1622.379924 | 9.811238176 | 282,471,177 |
| transcript | 8,215 | 39758.06549 | 98,328 | 172.3615654 | 2063.051491 | 11.96932441 | 261,206,210 |
| EVM | 15,173 | 27407.56403 | 165,668 | 165.6100695 | 1808.231002 | 10.91860542 | 388,418,680 |
Non-protein-coding genes annotation
The tRNAscan-SE (version 1.23) software with default parameters for eukaryote was used for tRNA annotation. rRNA annotation was based on homology information of plant rRNAs using BLASTN with parameters of “E-value = 1e-5”. The miRNA and snRNA genes were predicted by INFERNAL software (http://infernal.janelia.org, version 0.81) against the Rfam database (Release 11.0).
Statistics for Numida meleagris ncRNA annotation.
| Type | Copy Number | Avg. Length (bp) | Total Length (bp) | Pct.in Genome (%) |
|---|---|---|---|---|
| miRNA | 175 | 84.99428571 | 14874 | 0.001417 |
| tRNA | 294 | 75.17687075 | 22102 | 0.002105 |
| rRNA | 170 | 265.2941176 | 45100 | 0.004296 |
| 18S | 30 | 459.5666667 | 13787 | 0.001313 |
| 28S | 110 | 251.7818182 | 27696 | 0.002638 |
| 5.8S | 7 | 132.8571429 | 930 | 0.000089 |
| 5S | 23 | 116.826087 | 2687 | 0.000256 |
| snRNA | 251 | 128.9920319 | 32377 | 0.003084 |
| CD-box | 117 | 112.9316239 | 13213 | 0.001259 |
| HACA-box | 58 | 143.2758621 | 8310 | 0.000792 |
| Splicing | 63 | 140.1904762 | 8832 | 0.000841 |
Gene Function annotation
Gene functions were assigned according to the best match alignment using BLASTP against Swiss-Prot or TrEMBL databases. Gene motifs and domains were determined using InterProScan against protein databases including all databases . Gene Ontology IDs were obtained from the corresponding Swiss-Prot and TrEMBL entries. All genes were aligned against the KEGG proteins. The pathway to which the gene might belong was derived from the matching genes in KEGG.
Statistics for Numida meleagris gene function annotation.
| Number | Percent(%) | |
|---|---|---|
| Total | 15,173 | |
| InterPro | 13,492 | 88.92111 |
| GO | 10,934 | 72.062216 |
| KEGG | 13,430 | 88.512489 |
| Swissprot | 13,883 | 91.498056 |
| TrEMBL | 14,210 | 93.6532 |
| Annotated | 14,373 | 94.727476 |
| Unanotated | 800 | 5.272524 |