| Jump to section |
Gene family cluster | Phylogeny tree construct | Divergence time estimation |
| Expansion and contraction of gene families | 4dtv distance distribution calculation | Ks distribution calculation |
This part are some genome analysis, include Gene family cluster, Phylogeny tree construct, Divergence time estimation, Expansion and contraction of gene families, 4dtv distance distribution calculation and Ks distribution calculation
Gene family cluster
Using Treefam’s mcnes of other species were obtained from NCBI. We chose the transcripts with longest coding sequence to represent each gene. In summary, we first performed all-against-all comparison of all proteins using BLASTP with a cutoff of E-value < 1e-5 to both genes. OrthoMCL package (Version 1.4) was used to process high-scoring segment pairs (HSPs). MCL software in OrthoMCL was used to define final paralogous and orthologous genes with the parameter of “-abc – I=1 .5”.
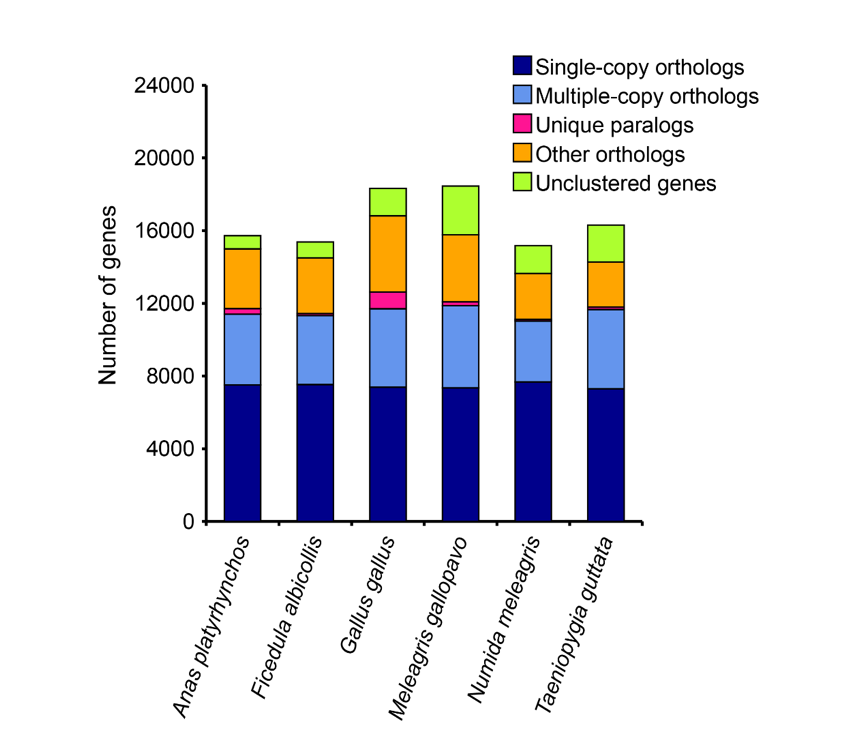
Figure: Orthology cluster compositions of Anas platyrhynchos, Gallus gallus, Meleagris gallopavo, Taeniopygia guttata, Ficedula albicollis and Numida meleagris.

Figure:Venn diagram showing the number of unique and shared gene families among Anas platyrhynchos, Gallus gallus, Meleagris gallopavo, Ficedula albicollis and Numida meleagris.
| Species | Genes number | Genes in families | Unclustered genes | Family number | Unique families | Average genes per family |
|---|---|---|---|---|---|---|
| Anas platyrhynchos | 15,722 | 15,002 | 720 | 11,716 | 90 | 1.28 |
| Ficedula albicollis | 15,381 | 14,499 | 882 | 11,873 | 44 | 1.22 |
| Gallus gallus | 18,330 | 16,817 | 1,513 | 12,390 | 157 | 1.36 |
| Meleagris gallopavo | 18,454 | 15,779 | 2,675 | 12,400 | 73 | 1.27 |
| Numida meleagris | 15,173 | 13,648 | 1,525 | 11,429 | 34 | 1.19 |
| Taeniopygia guttata | 16,307 | 14,270 | 2,037 | 11,140 | 36 | 1.28 |
Phylogeny tree construct
Comparative analysis of molecular sequence data is essential for reconstructing the evolutionary histories of species and inferring the nature and extent of selective forces shaping the evolution of genes and species. Hence, based on the most conserved single-copy orthologs, the phylogenic tree were reconstructed via Bayesian inference method.

Figure:Phylogenetic tree based on Bayesian inference analyses of a concatenated alignment of single-copy genes from Anas platyrhynchos, Gallus gallus, Meleagris gallopavo, Taeniopygia guttata, Ficedula albicollis and Numida meleagris.
Divergence time estimation
The program MCMCTREE program, implemented in PAML package, was used to estimate divergence time for all species . MCMCTree performs Bayesian estimation of species divergence times usingsoft fossil constraints .The HKY85 model (model=4) and independent rates molecular clock (clock=2) were used for calculation.The MCMC process of MCMCTREE was performed with the samples 1,000,000 times, with a sample frequency setting of 2, after a burnin of 200,000.The program uses for input a sequence alignment , a phylogenetic tree with fossil calibrations, and a control file (usuallycalled mcmctree.ctl).

Figure:Estimation of divergence time.
Expansion and contraction of gene families
We used CAFE (Computational Analysis of gene Family Evolution) for the statistical analysis of the evolution of the size of gene families. For a specified phylogenetic tree, and given the gene family sizes in the extant species, CAFE can estimate the global birth and death rate of gene families, infer the most likely gene family size at all internal nodes, identify gene families that have accelerated rates of gain and loss (quantified by a p-value) and identify which branches cause the p-value to be small for significant families.

Figure:The proportion of gene families expansion and contraction.
| Branch | Branch Length | n | Expansions | Contractions | Extinctions | No Change | Avg. Exp. | ||||||
| Families | Genes | Gene Gain/Family | Families | Genes | Gene Loss/Family | Families | Genes | ene Extinct/Family | |||||
| Mgal | 33 | 11,497 | 542 | 683 | 1.26015 | 574 | 589 | 1.02613 | 432 | 435 | 1.00694 | 10813 | 0.00776282 |
| Ggal | 33 | 11,481 | 383 | 607 | 1.58486 | 538 | 545 | 1.01301 | 448 | 452 | 1.00893 | 11008 | 0.00512016 |
| Ggal|Mgal | 33 | 11,929 | 121 | 157 | 1.29752 | 96 | 97 | 1.01042 | 70 | 70 | 1 | 11782 | 0.00495499 |
| Nme | 66 | 10,750 | 144 | 200 | 1.38889 | 1629 | 1797 | 1.10313 | 1249 | 1335 | 1.06886 | 10226 | -0.131885 |
| Nme|Ggal,Mgal | 3 | v11,999 | 2 | 2 | 1 | 115 | 115 | 1 | 110 | 110 | 1 | 11992 | -0.0093319 |
| Apla | 69 | 11,060 | 277 | 640 | 2.31047 | 1245 | 1287 | 1.03373 | 1049 | 1065 | 1.01525 | 10587 | -0.0534313 |
| Apla|Nme,Ggal,Mgal | 33 | 12,109 | 7 | 13 | 1.85714 | 35 | 38 | 1.08571 | 0 | 0 | #NAME? | 12067 | -0.00206458 |
| Tgut | 44 | 11,015 | 604 | 731 | 1.21026 | 1267 | 1288 | 1.01657 | 1094 | 1100 | 1.00548 | 10238 | -0.0459988 |
| Falb | 44 | 11,740 | 149 | 194 | 1.30201 | 432 | 441 | 1.02083 | 369 | 372 | 1.00813 | 11528 | -0.0203981 |
| Falb|Tgut | 59 | 12,109 | 36 | 46 | 1.27778 | 115 | 138 | 1.2 | 0 | 0 | #NAME? | 11958 | -0.00759765 |
4dtv distance distribution calculation
Using mcsan to find a pair of collinear genes, calculate the 4dtv distance of collinear gene pairs to make a distribution map.
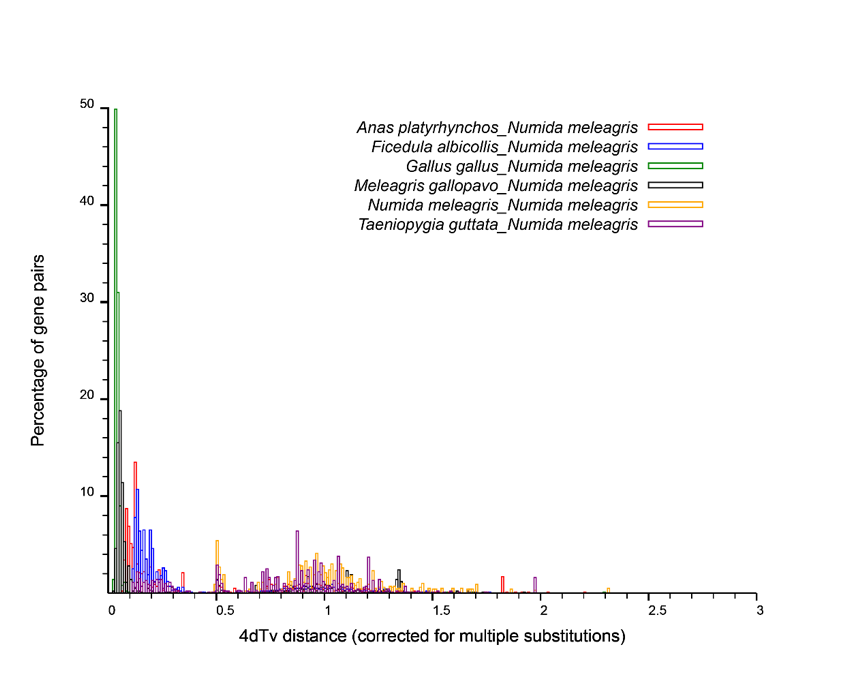
Figure:Whole-Genome Duplication Event in Numida meleagris. Diagram shows the own 4dTv distribution of Numida meleagris., and the tempoal relationship of Whole-Genome Duplication Event between Anas platyrhynchos, Gallus gallus, Meleagris gallopavo, Taeniopygia guttata, Ficedula albicollis.
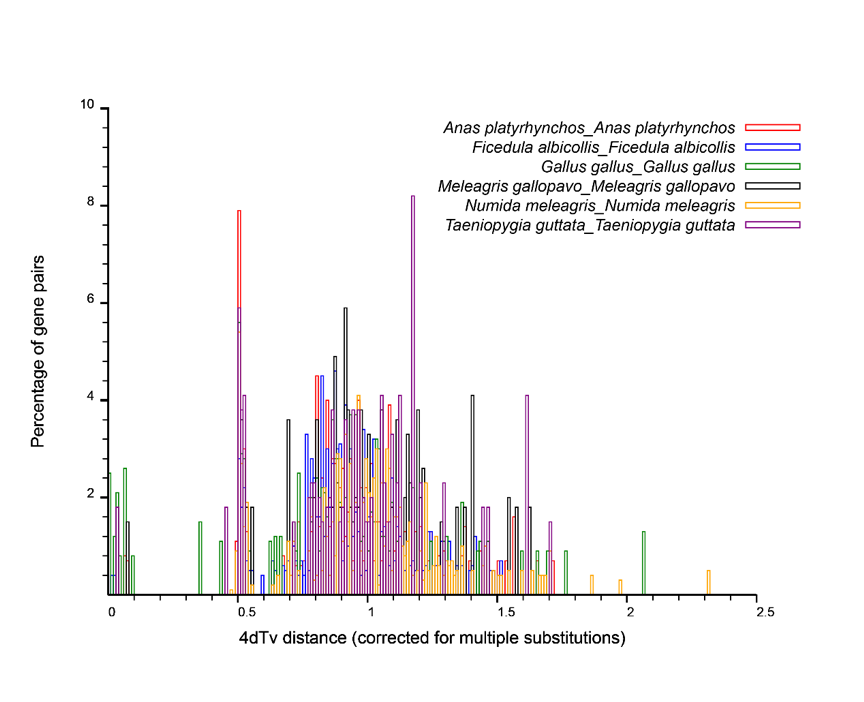
Figure:Whole-Genome Duplication Event in Numida meleagris. Diagram shows the own 4dTv distribution of Anas platyrhynchos, Gallus gallus, Meleagris gallopavo, Taeniopygia guttata, Ficedula albicollis.
Ks distribution calculation
To find the Tandem duplicated gene family according to BLASTP results (the intergene insertion number is less than 20). Perform MUSCLE to comparison the sequence of each gene family, then use yn00 in PAML to calculate the Ks value between the sequences and remove the Ks value greater than 2. Taking the median or the mean to represent the Ks value of each copy of the gene family. Add the Ks value for the interval which increment is 0.5 units.
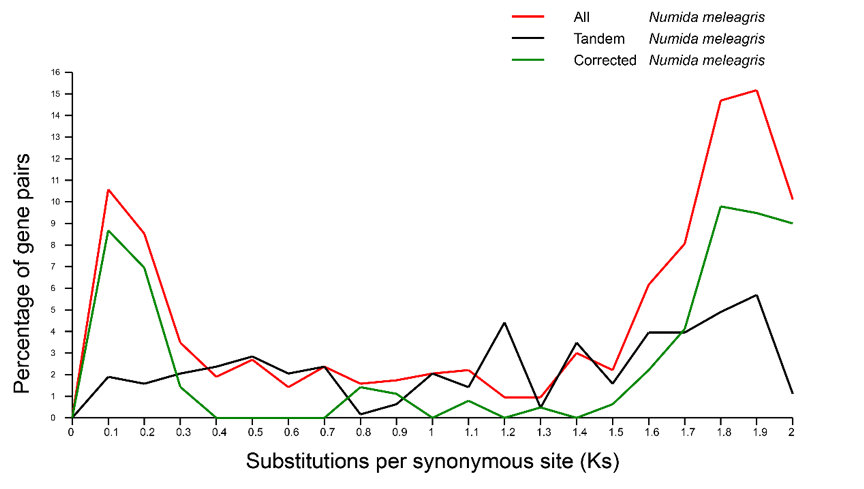
Figure:Analyse Ks distribution of Numida meleagris.